

Co-CIO Greg Jensen explains how changes to the composition of US debt issuance has temporarily averted some of the most important consequences of the tightening, and why this support to assets is likely to turn into a drag.
The “liquidity hole” is a term we’ve used in the past to describe the bearish pressure on bond yields due to the confluence of a number of important forces, including the Fed’s quantitative tightening and very large US government budget deficits. We expected the combination of these forces—particularly the Fed selling bonds and the Treasury needing to issue more debt—would add a significant amount of duration to the market and that this would suck money out of cash and assets, resulting in higher interest rates and lower asset prices.
What transpired was different, and, we believe, important for investors to understand despite its technical nature. In short, the Treasury has actually reduced net bond issuance and increasingly filled the funding gap created by deficits and QT with T-bills and spending cash on hand instead of issuing bonds. This has counteracted the impact of the liquidity hole and supported asset prices.
However, when we look at the Treasury’s goals and stated intentions, we think the liquidity hole we expected has been delayed but not eliminated. As the Treasury, advised by the Treasury Borrowing Advisory Committee (TBAC), stated in its quarterly refunding announcement earlier this week, bond issuance is now set to increase and will quickly approach a level more consistent with the large federal budget deficit.
We’re sharing a recent conversation between Daily Observations editor Jim Haskel and co-CIO Greg Jensen, in which they discuss these dynamics in more detail. You’ll hear Greg describe the mechanics of how the US Treasury changed its issuance patterns in a unique way, why this is likely not sustainable, how he’s assessing the impact of the liquidity hole going forward, and what all of this means for investors.
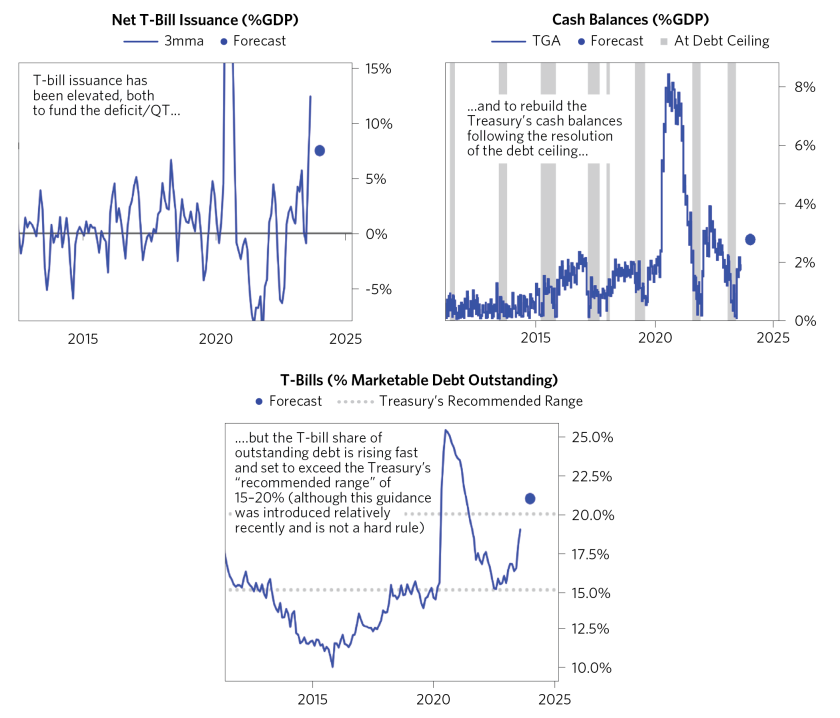
Below, we’ve also included a few visuals that help illustrate some of the key points from the discussion.

TRANSCRIPT
What Ever Happened to the Liquidity Hole?
Note: This transcript has been edited for readability.
“You’re still for an extended period of time going to have a budget deficit much bigger than the bond issuance absorbing that liquidity. That creates a level of money to slosh around in the real economy. I think that’s part of why the real economy has been as strong as it has been, is the budget deficit has had a larger multiplier effect because less of it’s being pulled out by duration and issuance. And that will continue. So that’s a positive dynamic. But on a change basis, bond issuance is rising at one of the fastest rates that it’s ever risen. This is a massive—a big change by Treasury standards into that world that we were talking about before. The Fed won’t be buying them. Banks are still unlikely to be buying them. So you’re starting to get what has been contained out there.”—Co-CIO Greg Jensen
Jim Haskel
I’m Jim Haskel, editor of the Bridgewater Daily Observations. The liquidity hole is a term that we’ve used to describe the bearish pressure on bond yields due to the confluence of a number of important forces, including the Fed’s quantitative tightening and very large US government budget deficits. We expected the combination of these forces, particularly the Fed selling bonds and the Treasury needing to issue more debt, would add a significant amount of duration to the market, and that this would suck money out of cash and assets and result in higher interest rates and therefore lower asset prices.
What actually transpired was a bit different, and we believe important for investors to understand, despite its technical nature. In short, the Treasury has actually reduced net bond issuance and increasingly filled the funding gap created by deficits and QT through the issuance of T-bills and spending cash on hand instead of issuing bonds. This has counteracted the impact of a liquidity hole and actually supported asset prices.
However, when we look at the Treasury’s goals and stated intentions, we think the liquidity hole we expected has been delayed, but importantly, not eliminated. As the Treasury, advised by the Treasury Borrowing Advisory Committee, or TBAC for short, announced in its quarterly refunding announcement earlier this week, bond issuance is now set to increase and will quickly approach a level more consistent with the large federal budget deficit.
So in today’s podcast, we’re sharing a conversation I had on Wednesday with co-CIO Greg Jensen to discuss these dynamics in more detail. And you’ll hear Greg describe the mechanics of how the US Treasury changes issuance patterns in a very unique way, and why this is likely not sustainable. You’ll also hear how he’s assessing the impact of the liquidity hole going forward and what all of this means for investors. And then we’ve also included a series of charts in the text of this Bridgewater Daily Observations that helps illustrate some of the key points from the discussion. So with that, let’s get right into the first question for Greg.
So, Greg, thanks so much for joining me. One of the big dynamics we’ve been tracking for a while now is the liquidity hole—basically the Fed rolling off its balance sheet and growing deficits and how these upward pressures on duration supply would enhance the tightening and be a big pressure on assets, especially with banks and the Fed, two of the biggest bond buyers, now largely out of the market. Yet we really haven’t seen that happen.
So my first question to you is, could you please explain what did happen, how we’re thinking about the liquidity hole right now, and some of the news related to that, which came out today?
Greg Jensen
So this is a great day. We’re recording this on the day of the TBAC. And I think about the Treasury laying out their issuance schedule. And for years—I mean, I remember when we first started studying supply/demand in the bond market, you always thought, well, Treasury issuance should probably matter since they’re the biggest supplier of bonds in the world. And yet it didn’t. Generally, when they issued bonds, it didn’t have any bond impact. They were very smooth in how they issued it. And the bond issuance tends to move up and down with the budget deficit, such that when the economy is weak, there’s more money available to buy bonds, which is when the issuance is higher. So, historically, there hasn’t been much edge in really understanding Treasury issuance in the bond market.
And today, though, I’d say this is now one of the most exciting macro releases—what are they going to do with Treasury issuance? Because it’s changed so much, and the magnitudes have shifted so much. In an MP3 world, all of a sudden what the Fed’s doing and what the Treasury is doing and the timing with what they’re doing—this becomes a major driver in a way that’s quite different.
So you’re right. I thought a lot about the liquidity hole, and I think the Fed running down QT was going to lead to more issuance of bonds as those bonds got rolled—that they get rolled out and that the banks and the bonds weren’t the buyers. That hasn’t turned out to be the case yet. And it’s really important to dig into the mechanics of why, because it’s been fascinating to watch.
One of the things I really expected was risk premiums would rise through the year, because as short rates rose, money would come from assets into cash. And as the Fed rolled off their balance sheet, that there’d be more bond supply and there’d be less liquidity. And one part of that was right: money has rushed into cash. Actually, the flow of money into cash, mutual funds, etc., has exceeded our expectations. It’s been vast into cash. But there’s been so much liquidity—that money flowed into cash, it also flowed into equities such that while bonds have sold off a little over the year, equities have rallied a lot. Generally, risky assets have done well. There’s been plenty of liquidity.
So how did that happen? And that’s the puzzle I’ve been wrestling with to improve our processes. And it’s just super interesting, because it’s quite different than most periods like this in history or anything like this. So you almost never see money rush into cash and money rush into equities at the same time. It’s almost never happened. So how’d it happen? And this is where the nuances of Treasury issuance become really important, because as the Fed was rolling off their balance sheet, the Treasury’s been replacing that with T-bills, not with bonds. And the Fed’s been running a huge budget deficit, actually a growing budget deficit that surprised on the upside, and even on Monday found out they need even more money than the rising budget deficit that had been suggested.
So there’s a huge need for government financing, but there’s been this decision to not disrupt the issuance. So they keep the gross issuance fairly constant. And when more debt’s rolling and the gross issuance is constant, the net issuance is actually declining. And so you’ve had this net issuance decline in bonds just because the Treasury schedule has lagged behind the needs, and the dynamic of QT and the tightening effect that would have has been caught because the Fed issued less bonds, not more. They ran a bigger budget deficit, which got money out into the real economy and into financial assets faster than they were absorbing it with duration issuance. And instead, T-bill issuance rose, but T-bill issuance was absorbed largely because there’s this huge repo facility that has been drawn down. And so the T-bill issuance has been absorbed easily.
This dynamic’s about to change. Bond issuance is gradually creeping up, and today you get the TBAC. It’s pretty exciting, because they’re tweaking it up at a somewhat faster rate. So that’s going to be a big deal going forward. Where you had a lot of excess liquidity, what you’re seeing in the Treasury’s plans released today and the changing dynamic is, all of a sudden, the pieces that have held liquidity up so high are changing quickly as you go out the next 9 to 12 months.
Jim Haskel
Greg, let me just summarize what you just said, because I think there’s a lot there. Effectively, the Treasury helped fill the liquidity hole by issuing more short-term debt that could easily be absorbed and less long-term debt that would have put pressure on rates and pulled money out of assets.
But now we’re starting to see signs of a reversal. And then, before we get into the forward-looking picture, maybe just give us a little bit of color on the impact of this declining net issuance on the market and the economy, because I think it’s important to really explain how debt issuance turned out to be more of a support than a drag.
Greg Jensen
Well, the net issuance is declining particularly into a period where the fiscal deficit is rising. So normally, the issuance and the deficit move together. What that does is that means that they were funding the budget deficit, which the deficit was money in people’s pockets that’s being spent on real goods and on financial assets. That isn’t being absorbed by Treasury bonds; instead, it was funded with T-bills.
And the money to get the T-bills didn’t come out of the budget deficit money, it actually just shifted from other inert cash sources. In this case, there’s a big repo facility the Fed’s been using essentially to absorb all the money in the world to maintain their short-term interest rate target—they’ve set up this repo facility. As T-bill rates rose and were in line with or slightly higher than the repo facility, money just shifted right out of that repo facility into the T-bills, which meant you could fund the budget deficit without absorbing any capital that was in use in the world. That increased the multiplier, that increased the amount of money available for long-duration and risky financial assets. And that’s the effect that you’ve seen over the last nine months.
Jim Haskel
So that’s one of the reasons why this cycle has been in elongated, in your view?
Greg Jensen
Yes, I think it’s been—there were two things that normally go together and I thought would spiral a little bit in the beginning of the year. Typically, as the Fed’s tightening and short rates are rising, the economy suffers from two sides of that: the higher interest rates pull savings rates up—that hurts the economy, and it pulls money out of financial assets into cash, which means lower asset prices then have a wealth effect. This dynamic we just talked about actually helped prevent both of those things from happening. And that, I think, did create support to the economy and markets over that period.
Jim Haskel
And then, looking ahead, you mentioned we’re likely to see a shift back to more bond issuance and effectively the delayed emergence of the liquidity hole. So what time period do you see that happening? Is it the next six to nine months going forward? Is that likely to be the brunt of it?
Greg Jensen
Well, the change—so then there’s the question of the level on the change. You’re still for an extended period of time going to have a budget deficit much bigger than the bond issuance absorbing that liquidity. That creates a level of money to slosh around in the real economy. I think that’s part of why the real economy’s been as strong as it has been, is the budget deficit has had a larger multiplier effect because less of it’s being pulled out by duration and issuance. And that will continue. So that’s a positive dynamic.
But on a change basis, bond issuance is rising at one of the fastest rates that it’s ever risen. Maybe a minor exception in the post-huge buildup of budget deficits during COVID. But this is a massive—a big change by Treasury standards into that world that we were talking about before. The Fed won’t be buying them. Banks are still unlikely to be buying them. So you’re starting to get what has been contained out there.
Now, it’ll be 9 to 12 months before the levels are also a big problem, but it’s starting to emerge, and I think you’re seeing it. I think if you take today’s market action—we’re here on Wednesday, and equities are down and bonds are down, and that’s the “not enough liquidity” market action. And I do think that that dynamic is starting to creep in again and will be a bigger part. And the stuff that we expected to happen over the prior nine months is actually more likely to happen as you look at the mechanics today.
Jim Haskel
One question I think a lot of our listeners might have, and I think it goes to the motivations behind the normalization of Treasury issuance that you’re describing, is how does the Treasury actually decide whether to issue bonds versus bills? What’s the rationale behind that decision?
Greg Jensen
Well, the Treasury’s goal is not to have outsize impact on the bond market. So they generally want to keep the issuance calendar reasonably constant and just let it creep up to catch up. So what happens is when there’s a surprise—let’s say you go into COVID, there’s a surprise. They issue it all in T-bills—they don’t change their calendar right away. And then they gradually increase the bond issuance and take down the T-bill issuance. So they have a range between 15% and 20% where they want to keep the gross T-bills relative to the bonds in that range. Now, that’s not a hard range, and they’re definitely discussing potentially being outside of that range as they’re surging past it.
But the main goal was, well, how do we issue tons of bonds without having a big impact on the bond market? And for that, they’re looking at gross issuance, which gets confusing when there’s a lot of—when there are a lot of bonds rolling off, gross issuance all of a sudden could be very different than net issuance. And by keeping gross issuance relatively constant recently, they’ve fallen way behind on net issuance. And that’s partially because the budget deficit surprised them to some degree, and partially because they just want to be very gradual.
But now they’ve fallen so far behind, and they also have the desire to catch up. They do want to maintain somewhere between the debt stock with 15% to 20% of T-bills, not way above that. Now, they could give on that a little bit, but it seems like the decision—this is not an attempt to stimulate the economy. It’s much more of an attempt to not affect markets by having radical changes in the bond issuance calendar.
But when you do that and the situation beneath it is changing as quickly as it is, they’re forced into adjustments. That’s the kind of thing that becomes market-moving today, is the Treasury making bigger adjustments than people expected coming into today. And the direction is becoming more and more clear that they are going to try not to have T-bill issuance surge for too much longer, which means they’ve got a lot of catch-up bond issuance to do.
Jim Haskel
Then, Greg, you mentioned the Treasury typically doesn’t want to have an outsize impact on the bond market. But just to be clear, that’s all in the service, I would imagine, of satisfying the buyer—issuing in places on the yield curve where there’s most demand and ultimately achieving the larger goal of getting the cheapest possible funding. Is that right?
Greg Jensen
Yes, they do surveys to try to do that, and they also think about the gross rolls too that I think they want to keep—there’s plenty of T-bill demand. They could go beyond that, but they also want to keep some degree of safety. The more you have to roll, the more roll problems become issues and technical things become issues. So I think they’re pretty conservative on the amount they want to have in T-bills for those reasons—a little bit beyond the demand.
But you’re right, they’ve surveyed the demand. In fact, that’s another thing they mentioned is they’re also trying to get rid of the issues that don’t have demand. So the buyback announcement they made recently, which is not intended to affect bond supply or whatever, but will take out the places where there’s no liquidity and issue into the places where there’s a lot of liquidity. So that’s the thing they’re trying to manage with the long-term goal of lowering debt cost by hitting the places where there’s natural demand.
Jim Haskel
You touched on this a little bit before, but just to be clear: can you probabilistically talk through what you expect in terms of the impact of this shift on the bond and stock markets, as well as the economy?
Greg Jensen
Yes, and I think I should have been more clear about this at the beginning of the year, so let me make it clear now. So much we don’t know. So easily could be wrong about all of these things. But taking in what I’m seeing and how our pressures are being manifest in our process, I think you’re seeing the turning point in liquidity in a big way. What the Treasury is announcing and showing and what’s likely to come is, on a change basis, a fair amount more issuance. So on a level basis, still a budget deficit much higher than the bond issuance.
On net, with everything else going on, we still expect a slowing of the economy—less so than we did before, but a slowing in the economy. And you’ve got a fair amount of government spending relative to the budget deficit that’ll help support the economy as well as other things going on—the strength of wages and the labor market. And I think you’re at the turning point for financial markets and the liquidity, the change being pretty relevant.
And I think, although we expect the peak of that to happen a little more gradually, the peak of the liquidity squeeze, probably where the level and the change are the worst together is probably 9, 12 months out. But it’s getting worse, and we’ll be monitoring to see how that plays out. But risk premiums have been declining this year. And based on these measures and everything that we’re seeing, I think you’re starting to see that potentially shift.
And I think that’s a pretty big deal in the markets and a big deal in understanding what has happened and likely what will happen. It’s easier to say what has happened than what will happen, because there’s a bunch of other things. How does the Fed interact with this? Does quantitative tightening—does that path change? Those types of things will matter as you go out 9 to 12 months. But at this point, you definitely see the setup for a very different liquidity picture going forward.
Jim Haskel
Last question. This discussion, Greg, has been more of a technical discussion than we usually have. And I think these types of issues and the TBAC and the like aren’t something that have really made headlines traditionally. So my question to you is, the issues we discussed today, are they likely to be increasingly important dynamics in markets going forward?
Greg Jensen
I think this, in an MP3 world, all of a sudden, the dynamics between quantitative tightening and Treasury issuance are a much bigger deal than it has been historically. I think when you look at the reason risk premiums—where did the money come from? How could it be that money could go into cash and equity simultaneously? I think this is the root of the reason. So I think this is really critical.
And then the fact that we can chart out the path for where this is going, and the Treasury’s laying out their path, and it’s logical, given the goal to not have T-bill issuance take over the whole debt market and how far behind bond issuance has been from the deficit, that this thing has to change. And the exact speed of it, we’ll see. But it has to change. The announcement today illustrates the Treasury knows it has to change. They’re actually going a little faster than people had expected a couple of days ago.
So that transformation of the liquidity picture is likely a little bit ahead of the schedule, at least as of two days ago. And that’s been a big dynamic. So, I think, we go through these eras. Like in the ‘80s, everybody’s looking at M2 all the time. Nobody looks at M2 reports every day. And I remember Alan Greenspan with corrugated cardboard, and all of a sudden, people are watching the corrugated cardboard price. And you go through initial claims, or for a long time we really liked the employment cost index. And today, I think the TBAC is the thing that’s probably, other than the employment report, the biggest market-moving day, because it’s reflecting this very important liquidity dynamic. And in the world of MP3, the choices that usually don’t matter that much matter a ton.
Jim Haskel
Great. Well, Greg, thank you so, so much. I think we’ll leave it there. And thank you so much for your time.
This research paper is prepared by and is the property of Bridgewater Associates, LP and is circulated for informational and educational purposes only. There is no consideration given to the specific investment needs, objectives, or tolerances of any of the recipients. Additionally, Bridgewater's actual investment positions may, and often will, vary from its conclusions discussed herein based on any number of factors, such as client investment restrictions, portfolio rebalancing and transactions costs, among others. Recipients should consult their own advisors, including tax advisors, before making any investment decision. This material is for informational and educational purposes only and is not an offer to sell or the solicitation of an offer to buy the securities or other instruments mentioned. Any such offering will be made pursuant to a definitive offering memorandum. This material does not constitute a personal recommendation or take into account the particular investment objectives, financial situations, or needs of individual investors which are necessary considerations before making any investment decision. Investors should consider whether any advice or recommendation in this research is suitable for their particular circumstances and, where appropriate, seek professional advice, including legal, tax, accounting, investment, or other advice.
The information provided herein is not intended to provide a sufficient basis on which to make an investment decision and investment decisions should not be based on simulated, hypothetical, or illustrative information that have inherent limitations. Unlike an actual performance record simulated or hypothetical results do not represent actual trading or the actual costs of management and may have under or over compensated for the impact of certain market risk factors. Bridgewater makes no representation that any account will or is likely to achieve returns similar to those shown. The price and value of the investments referred to in this research and the income therefrom may fluctuate. Every investment involves risk and in volatile or uncertain market conditions, significant variations in the value or return on that investment may occur. Investments in hedge funds are complex, speculative and carry a high degree of risk, including the risk of a complete loss of an investor’s entire investment. Past performance is not a guide to future performance, future returns are not guaranteed, and a complete loss of original capital may occur. Certain transactions, including those involving leverage, futures, options, and other derivatives, give rise to substantial risk and are not suitable for all investors. Fluctuations in exchange rates could have material adverse effects on the value or price of, or income derived from, certain investments.
Bridgewater research utilizes data and information from public, private, and internal sources, including data from actual Bridgewater trades. Sources include BCA, Bloomberg Finance L.P., Bond Radar, Candeal, Calderwood, CBRE, Inc., CEIC Data Company Ltd., Clarus Financial Technology, Conference Board of Canada, Consensus Economics Inc., Corelogic, Inc., Cornerstone Macro, Dealogic, DTCC Data Repository, Ecoanalitica, Empirical Research Partners, Entis (Axioma Qontigo), EPFR Global, ESG Book, Eurasia Group, Evercore ISI, FactSet Research Systems, The Financial Times Limited, FINRA, GaveKal Research Ltd., Global Financial Data, Inc., Harvard Business Review, Haver Analytics, Inc., Institutional Shareholder Services (ISS), The Investment Funds Institute of Canada, ICE Data, ICE Derived Data (UK), Investment Company Institute, International Institute of Finance, JP Morgan, JSTA Advisors, MarketAxess, Medley Global Advisors, Metals Focus Ltd, Moody’s ESG Solutions, MSCI, Inc., National Bureau of Economic Research, Organisation for Economic Cooperation and Development, Pensions & Investments Research Center, Refinitiv, Rhodium Group, RP Data, Rubinson Research, Rystad Energy, S&P Global Market Intelligence, Sentix Gmbh, Shanghai Wind Information, Sustainalytics, Swaps Monitor, Totem Macro, Tradeweb, United Nations, US Department of Commerce, Verisk Maplecroft, Visible Alpha, Wells Bay, Wind Financial Information LLC, Wood Mackenzie Limited, World Bureau of Metal Statistics, World Economic Forum, YieldBook. While we consider information from external sources to be reliable, we do not assume responsibility for its accuracy.
This information is not directed at or intended for distribution to or use by any person or entity located in any jurisdiction where such distribution, publication, availability, or use would be contrary to applicable law or regulation, or which would subject Bridgewater to any registration or licensing requirements within such jurisdiction. No part of this material may be (i) copied, photocopied, or duplicated in any form by any means or (ii) redistributed without the prior written consent of Bridgewater® Associates, LP.
The views expressed herein are solely those of Bridgewater as of the date of this report and are subject to change without notice. Bridgewater may have a significant financial interest in one or more of the positions and/or securities or derivatives discussed. Those responsible for preparing this report receive compensation based upon various factors, including, among other things, the quality of their work and firm revenues.