

I’ve seen a lot of bubbles in my time and I have studied even more in history, so I know what I mean by a bubble and I systemized it into a “bubble indicator” that I monitor to help give me perspective on each market. We now use it to look at most markets we are in. I want to show you how it works and what it is now showing for US stocks.
What I mean by a bubble is an unsustainably high price, and how I measure it is with the following six measures.
- How high are prices relative to traditional measures?
- Are prices discounting unsustainable conditions?
- How many new buyers (i.e., those who weren’t previously in the market) have entered the market?
- How broadly bullish is sentiment?
- Are purchases being financed by high leverage?
- Have buyers made exceptionally extended forward purchases (e.g., built inventory, contracted forward purchases, etc.) to speculate or protect themselves against future price gains?
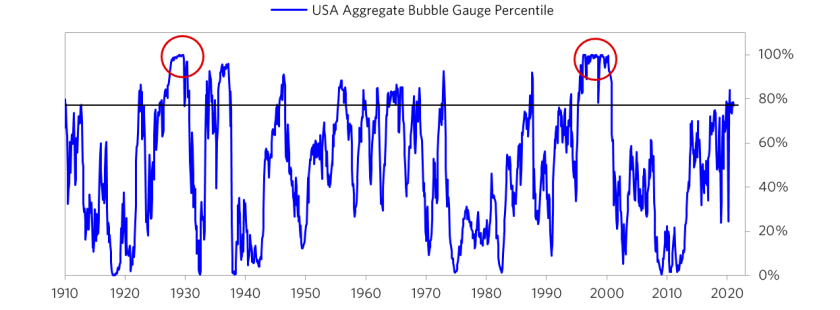
Each of these six influences is measured using a number of stats that are combined into gauges. In the stock market we do it for each stock that we are looking at. These gauges are combined into aggregate indices by security and then for the market as a whole. The table below shows the current readings of each of these gauges for the US equity market as a whole, and the chart below it shows the aggregate reading derived by combining these gauges into one reading for the stock market going back to 1910. It shows how the conditions stack up today for US equities in relation to past times.
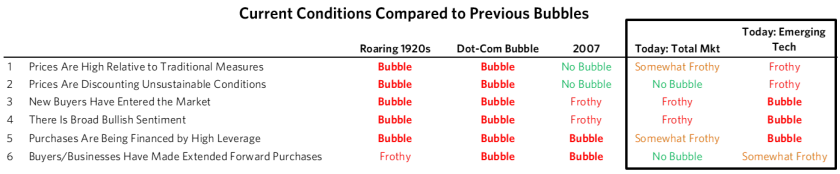
In brief, the aggregate bubble gauge is around the 77th percentile today for the US stock market overall. In the bubble of 2000 and the bubble of 1929 this aggregate gauge had a 100th percentile read.
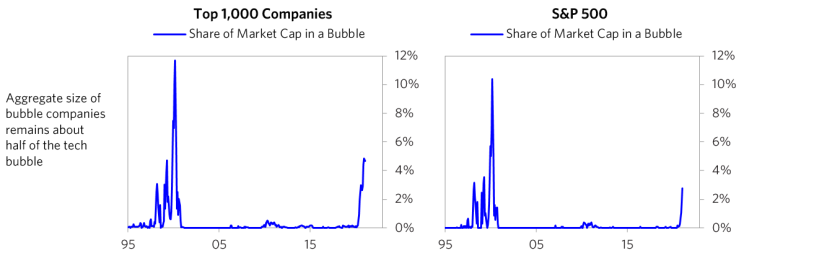
There is a very big divergence in the readings across stocks. Some stocks are, by these measures, in extreme bubbles (particularly emerging technology companies), while some stocks are not in bubbles. The charts below show the share of US companies that these measures indicate being in a bubble. It is about 5% of the top 1,000 companies in the US, which is about half of what we saw at the peak of the tech bubble. The number is smaller for the S&P 500 as several of the most bubbly companies are not part of that index.
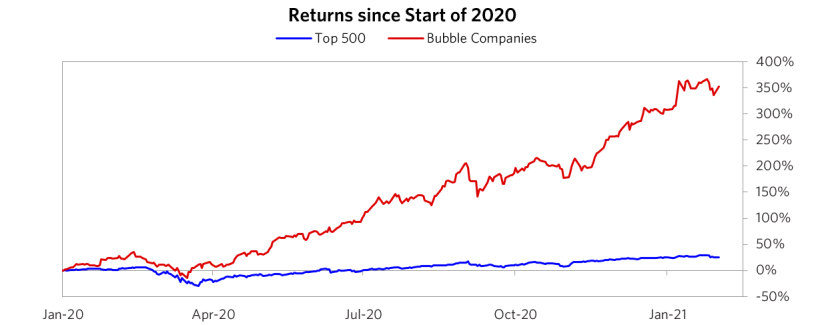
We took the stocks that are in bubbles and created a basket of the “bubble stocks” to keep a close eye on them. The chart below shows their performance and the performance of our basket of the top 500 companies. This market action is reminiscent of the “Nifty Fifty” in the early 1970s and the dot-com bubble stocks in the late 1990s, both of which I remember well. It scores similarly to the bubble stocks of the late 1920s, which I can’t remember because I wasn’t alive then.
While I won’t show you exactly how this indicator is constructed because that is proprietary, I will show you some of the sub-aggregate readings and some indicators.
1. How High Are Prices Relative to Traditional Measures?
The current read on this price gauge for US equities is around the 82nd percentile, shy of what we saw in the 1929 and 2000 bubbles.

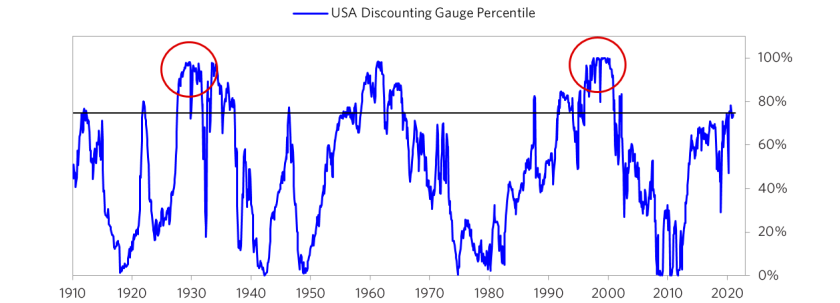
2. Are Prices Discounting Unsustainable Conditions?
This measure calculates the earnings growth rate that is required to produce equity returns in excess of bond returns. This is derived by looking at individual securities and adding up their readings. Currently this indicator is around the 77th percentile for the aggregate market. This indicator shows that while stock prices in aggregate are high in relation to the absolute returns they are to provide, they are not extremely high in relation to their bond market competitors. In both 1929 and 2000 this measure was at the 100 percentile.
3. How Many New Buyers (i.e., Those Who Weren’t Previously in the Market) Have Entered the Market?
A rush of new entrants attracted by rising prices is often indicative of a bubble. That is because they are typically entering the market because it is hot and because they are unsophisticated. This was the case in both the 1929 and 2000 equity bubbles. This gauge has reached the 95th percentile recently due to the flood of new retail investors into the most popular stocks, which by other measures also appear to be in a bubble.

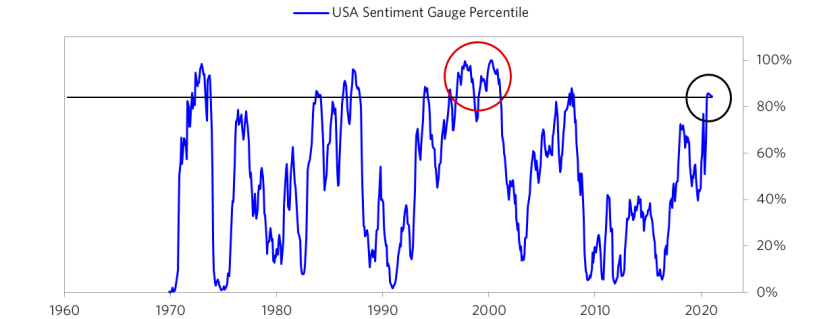
4. How Broadly Bullish Is Sentiment?
The more bullish the sentiment, the more people have already invested, so the less likely they will invest more and the more likely that they will sell. Our aggregate market sentiment gauge is now around the 85th percentile. Once again, it is heavily concentrated in the “bubble stocks” rather than most stocks.
As shown below, IPOs have been exceptionally hot—the hottest since the 2000 bubble.

The current IPO pace has been brought about by the sentiment previously mentioned, as well as the SPAC boom, as these blank-check acquisition companies have lower regulatory hurdles and greater flexibility to bring more speculative companies into the public markets. The main reason the overall read on both sentiment and aggregate frothiness for the entire market is shy of what we saw in past bubbles is that not all players are showing the same degree of exuberance. For example, sentiment from professional equity managers has moderated recently to more average levels, and corporate financial engineering (in the form of buybacks and M&A) remains mediocre as they are still working through the hit from the pandemic.
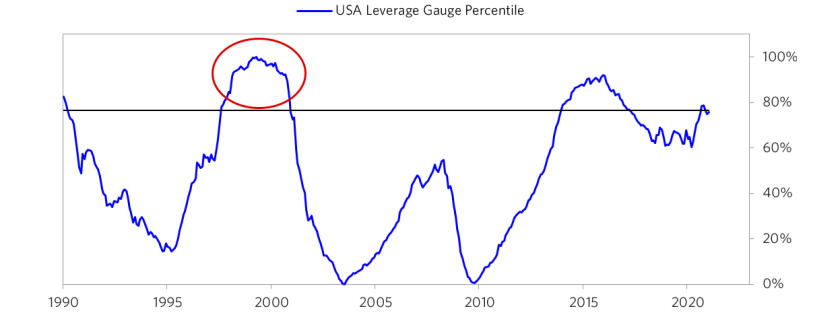
5. Are Purchases Being Financed by High Leverage?
Leveraged purchases make the underpinnings of the buying weaker and more vulnerable to forced selling in a downturn. Our leverage gauge, which looks at the leverage dynamics across all the key players and treats option positions as a form of leverage, is now showing a read just shy of the 80th percentile. Like some of our other bubble measures, there is high leverage being deployed by the retail segment (using options) in “bubble stocks,” while there is much less leveraging by other investors and in non-bubble stocks.
As shown below, volume in single-stock call options is at record highs. Retail purchases of options have been the big contributor to this surge. Outside the retail sector we aren’t seeing excessive leveraged buying.

6. To What Extent Have Buyers Made Exceptionally Extended Forward Purchases?
One perspective on whether expectations have become overly optimistic comes from looking at forward purchases. We apply this gauge to all markets and find it particularly helpful in commodity and real estate markets where forward purchases are most clear. In the equity markets we look at indicators like capital expenditure—whether businesses (and, to a lesser extent, the government) are investing a lot or a little in infrastructure, factories, etc. It reflects whether businesses are extrapolating current demand into strong demand growth going forward. This gauge is the weakest across all our bubble gauges, pulling down the aggregate read. Corporations are the most important entity in terms of driving this piece via capex and M&A. Today aggregate corporate capex has fallen in line with the virus-driven hit to demand, while certain digital economy players have managed to maintain their levels of investment. Similarly levels of M&A activity remain subdued so far.

What one chooses to do with this is a tactical decision. Even if this gauge is perfectly accurate (which it is not) timing tops and bottoms based on it is precarious because while it shows what neighborhood these stocks are in, there is nothing precise about it. So it is tough to pick the levels and timing of tops and bottoms based on it. Having said that, we have found that it is a pretty good predictor of relative performance of stocks over the subsequent three to five years. As a result, while it contributes to our increasingly favoring non-bubble stocks, we need to combine it with timing indicators. I just wanted to pass this along to you because I found it helpful and thought you might too in light of what’s now going on in the markets.
This research is prepared by and is the property of Bridgewater Associates, LP and is circulated for informational and educational purposes only. There is no consideration given to the specific investment needs, objectives or tolerances of any of the recipients. Additionally, Bridgewater’s actual investment positions may, and often will, vary from its conclusions discussed herein based on any number of factors, such as client investment restrictions, portfolio rebalancing and transactions costs, among others. Recipients should consult their own advisors, including tax advisors, before making any investment decision. This report is not an offer to sell or the solicitation of an offer to buy the securities or other instruments mentioned.
Bridgewater research utilizes data and information from public, private and internal sources, including data from actual Bridgewater trades. Sources include the Australian Bureau of Statistics, Bloomberg Finance L.P., Capital Economics, CBRE, Inc., CEIC Data Company Ltd., Consensus Economics Inc., Corelogic, Inc., CoStar Realty Information, Inc., CreditSights, Inc., Dealogic LLC, DTCC Data Repository (U.S.), LLC, Ecoanalitica, EPFR Global, Eurasia Group Ltd., European Money Markets Institute – EMMI, Evercore ISI, Factset Research Systems, Inc., The Financial Times Limited, GaveKal Research Ltd., Global Financial Data, Inc., Haver Analytics, Inc., ICE Data Derivatives, IHSMarkit, The Investment Funds Institute of Canada, International Energy Agency, Lombard Street Research, Mergent, Inc., Metals Focus Ltd, Moody’s Analytics, Inc., MSCI, Inc., National Bureau of Economic Research, Organisation for Economic Cooperation and Development, Pensions & Investments Research Center, Renwood Realtytrac, LLC, Rystad Energy, Inc., S&P Global Market Intelligence Inc., Sentix Gmbh, Spears & Associates, Inc., State Street Bank and Trust Company, Sun Hung Kai Financial (UK), Refinitiv, Totem Macro, United Nations, US Department of Commerce, Wind Information (Shanghai) Co Ltd, Wood Mackenzie Limited, World Bureau of Metal Statistics, and World Economic Forum. While we consider information from external sources to be reliable, we do not assume responsibility for its accuracy.
The views expressed herein are solely those of Bridgewater as of the date of this report and are subject to change without notice. Bridgewater may have a significant financial interest in one or more of the positions and/or securities or derivatives discussed. Those responsible for preparing this report receive compensation based upon various factors, including, among other things, the quality of their work and firm revenues.