

Though every economy and market in the world was largely subjected to the same first-order effects of the pandemic, today both levels of activity and the likely path forward are vastly different, predominantly as a result of how policy makers responded. The current gap between levels of activity in China and the rest of the world is huge in large part because of an effective policy response. After an aggressive and early shutdown that brought the pandemic under control, swift easing coordinated across multiple levers fostered a rapid recovery. Then policy makers pulled back somewhat in order to avoid creating excesses, such as those seen in prior easings. The difference in economic outcomes, combined with policy responses, led to differentiated asset returns. The bond rally that happened in the rest of the world was largely absent. The strong economy and tightening contributed to one of the strongest currencies globally. Equity performance benefited from a strong economy, but that was offset by the tightening and rising of geopolitical tensions.
Looking ahead, unlike most of the world, China still has the monetary lever available. Today, China offers a government bond yield of about 3%, making it one of the few places where bonds offer reasonable returns and diversification benefits. China has a strong balance of payments and strong secular growth prospects. These huge divergences in levels of activity coupled with the heightened potential for conflicts—both across and within countries—increase the likelihood that economic and financial outcomes will continue to be less correlated than they have been in recent decades. Geographic diversification has never been more important for investors, and given its size, rapidly opening capital markets, different place in the business cycle, and non-zero rates, tracking China closely has never been more important.

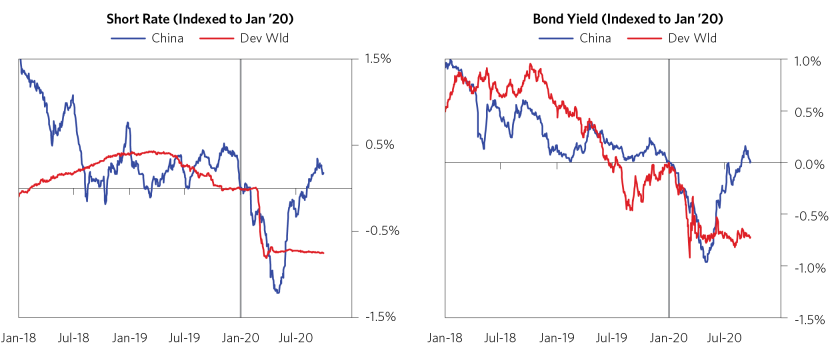
Market action reflects these shifting fundamentals. The charts below show the performance of a selection of Chinese assets against a basket of developed world assets. As you can see, China’s market outcomes have also been meaningfully differentiated from those in the developed world. The rebound in the economy, control of the virus, and continued fiscal policy easing have given policy makers enough confidence to reverse the prior monetary easing. China is in the unique position of being one of the only major economies still offering a reasonable yield, with enough fuel in the tank to offset further weakness by using the rates lever if conditions warrant it. That combination of economic outperformance and a relatively higher yield has led to the divergence of Chinese assets from the developed world.

Chinese market and economic conditions have historically been lowly correlated to developed world conditions. Geographic diversification can be a lifesaver in times of crisis, and even outside of major crisis-like events, there is always a divergence between the best- and worst-performing economies over any given period. Given that, a geographically diversified portfolio creates a more consistent return stream. This approach sidesteps trying to predict whether China’s or other countries’ domestic or geopolitical problems are over- or under-discounted and ensures that a localized crisis doesn’t have a disproportionate effect on portfolios.
We show the historical correlations in the table below (going as far back as we could find reliable Chinese data).

China’s policy makers are continuing to move aggressively to open their markets and capital account and to strengthen the RMB as a world currency. At the same time, global capital inflows are being fostered by increased shares of major market indices, and these markets are underinvested in relative to the markets in developed countries (especially the US). The table below shows measures taken by policy makers this year to further open the capital markets.

A Deeper Look at How China Balanced Virus Management with Economic Management
As noted at the beginning of this research paper, China stands out as one of the only economies where activity has returned to near 2019 levels. Below, we walk through the cyclical conditions and the balance of policy levers that allowed for such a rapid recovery and we provide some perspective on what we expect to see going forward.
China’s recovery has been predominantly led by strong production, while domestic consumption has recovered at a somewhat slower pace. This dynamic is different from what we have seen across most of the rest of the world, where the recovery in domestic consumption has led a recovery in production. In part, this reflects the strength in manufacturing exports. It also reflects the composition of the easing—with policy makers in China targeting businesses more directly. Below, we show the major Chinese stats against the same stats in the US for perspective.

At the same time, Chinese exports have also outperformed—recovering to well above levels seen in 2019—while global levels of activity remain weak. This perspective is shown in the chart below on the left. This has largely been a result of China’s swift reopening and ability to bring manufacturing online quickly to meet global demand. Additionally, China was able to retool factories rapidly in order to provide COVID-related supplies, and meeting that demand has been a major support. You can see this below in the chart on the right, along with the fact that the exports gain has begun to grow more broad-based. Going forward, we expect some of this support to fade—but the level difference between China and other countries’ exports is likely to be a bit sticky, especially as the recovery slows everywhere and with most other economies still far from bringing their full manufacturing capacity back online.

The chart below helps to give more of a long-term perspective on how meaningful the boost in China’s export market share has been during the COVID crisis. As you can see, this year marks one of the more rapid increases in Chinese market share in the last two decades.

But domestic consumption has lagged the recovery somewhat, especially in contact-intensive sectors that are particularly sensitive to the virus, such as catering (which makes up 10% of retail sales). As you can see in the chart on the left below, spending in other sectors has recovered considerably more. While income growth declined in the first quarter, it never contracted in aggregate and has since improved. In urban areas, the unemployment rate has come down in recent months after a jump during the COVID crisis.

The composition of the recovery (stronger production, relatively weaker consumption) has been largely a product of how fiscal easing has been directed so far, with most easing coming from direct government spending and stimulus targeted at businesses, with very little direct support to households. This composition is very different from what we have seen elsewhere, such as in the US. But the stimulus has still been significant enough to help the recovery experienced in the second and third quarters.

As Coordinated Policy Stimulus Has Driven the Economy Back to Normal, Policy Makers Have Begun to Shift Toward a More Neutral Stance
Looking back, Chinese policy makers dealt with the crisis with a package of coordinated fiscal, regulatory, and monetary stimulus, preferring targeted over broad easing. China’s credit excesses of the last decade put it in a different place than the West in terms of the mix of policies they want to use. There is much less tolerance for allowing a rekindling of credit excesses. Even at the peak of easing in response to the pandemic, we saw a much smaller monetary easing than in the global financial crisis. The charts below provide perspective on Chinese debt levels.

As you can see in the charts below, the bulk of the easing came from 1) regulatory easing on debt rollovers, etc., to stop the economy from free-falling; 2) direct fiscal spending, mostly on infrastructure; and 3) a combination of regulatory policies and monetary accommodation to direct credit to private enterprises.

So far, the tightening on the short end of the curve as well as continued regulatory policies have successfully contained financial arbitrage activities and debt buildup in areas considered opaque and unproductive, without draining the real economy—thanks to the targeted fiscal easing that encouraged on-balance-sheet financing for infrastructure projects and directed credit to private businesses. The charts below show strength in credit creation (especially government-related credit) and bank loans to private businesses. It’s encouraging that China has been able to get more and cheaper credit to SMEs during the COVID crisis—interest charged on SME loans continued to decline in the first half of 2020 compared to 2019—something that’s historically been hard to achieve.

In order to prevent second-order effects from cascading, it is important in a crisis to make sure that small businesses are covered. China is getting money to small businesses in a different way than the West, relying more heavily on banks providing credit (often with the aid of fin-tech companies helping to assess credit quality). In the West, we have seen more direct government transfers to small businesses. China’s banks are in a relatively stronger position to make these loans today versus in prior years because, before the COVID crisis, policy makers had been through a process of cleaning up the banking system. But if we ultimately see the government stepping in to help to cover bank losses, the dynamics will be similar across regions.

With the same long-term concerns about frothy financial conditions in mind, we have also begun to see regulatory tightening in housing (mostly targeted at developer financing). Regulators have introduced three new “red lines” to limit developers’ corporate debt, imposing caps on developers’ net new annual debt creation. The chart below puts the tightness of property regulation in perspective. The moves so far have been a modest tapping on the brakes as the need to ease has ebbed. In other words, China is trying to both get money into the hands of those who need it while using macroprudential policies to prevent excesses. This balanced approach looks quite different than what we are seeing in the US, where pockets of speculation have popped up in the equity market.

And we have already started to see the impacts of this policy flow-through, with housing activity stats coming in weaker since the new regulation has been introduced.

On net, we expect the mix of government policies to have a positive impact on growth, though a marginally smaller one going forward. The quotes below (roughly translated) help to shed some light on how policy makers are processing current conditions and planning to alter their stance going forward.
On continuing to direct the financial system to support the real economy:
“The financial system has played an important role in economic recovery. We must continue to maintain the reasonable strength of financial support policies for the real economy, promote service innovation, and expand inclusive finance. Prevent financial risks.”—Premier Li Keqiang
On preventing the risk of financial excesses:
“If the central bank’s monetary policy creates a lot of liquidity, no matter how well structural adjustments are made, a considerable amount of capital will naturally flow into these asset areas, including real estate and the stock market. Therefore, asset bubbles will inevitably emerge under the ‘flooding’ conditions. This risk should be prevented.”—Ma Jun, member of the PBoC Monetary Policy Committee
Finally, on maintaining adequate fuel in the tank in case of downside risks:
“We don’t know whether Sino-US relations will deteriorate significantly in the coming period. We don’t know whether something will happen to the small banks. We don’t know whether something will happen to the local financing vehicles. We don’t know. If these things happen, we may have to have more ‘bullets’ and use more monetary resources to deal with them. Therefore, it is impossible to exhaust all the ‘bullets.’ Some have to be stored in case of an emergency.”—Ma Jun, member of the PBoC Monetary Policy Committee
This research paper is prepared by and is the property of Bridgewater Associates, LP and is circulated for informational and educational purposes only. There is no consideration given to the specific investment needs, objectives or tolerances of any of the recipients. Additionally, Bridgewater's actual investment positions may, and often will, vary from its conclusions discussed herein based on any number of factors, such as client investment restrictions, portfolio rebalancing and transactions costs, among others. Recipients should consult their own advisors, including tax advisors, before making any investment decision. This report is not an offer to sell or the solicitation of an offer to buy the securities or other instruments mentioned.
Bridgewater research utilizes data and information from public, private and internal sources, including data from actual Bridgewater trades. Sources include the Australian Bureau of Statistics, Bloomberg Finance L.P., Capital Economics, CBRE, Inc., CEIC Data Company Ltd., Consensus Economics Inc., Corelogic, Inc., CoStar Realty Information, Inc., CreditSights, Inc., Dealogic LLC, DTCC Data Repository (U.S.), LLC, Ecoanalitica, EPFR Global, Eurasia Group Ltd., European Money Markets Institute – EMMI, Evercore ISI, Factset Research Systems, Inc., The Financial Times Limited, GaveKal Research Ltd., Global Financial Data, Inc., Haver Analytics, Inc., ICE Data Derivatives, IHSMarkit, The Investment Funds Institute of Canada, International Energy Agency, Lombard Street Research, Mergent, Inc., Metals Focus Ltd, Moody’s Analytics, Inc., MSCI, Inc., National Bureau of Economic Research, Organisation for Economic Cooperation and Development, Pensions & Investments Research Center, Renwood Realtytrac, LLC, Rystad Energy, Inc., S&P Global Market Intelligence Inc., Sentix Gmbh, Spears & Associates, Inc., State Street Bank and Trust Company, Sun Hung Kai Financial (UK), Refinitiv, Totem Macro, United Nations, US Department of Commerce, Wind Information (Shanghai) Co Ltd, Wood Mackenzie Limited, World Bureau of Metal Statistics, and World Economic Forum. While we consider information from external sources to be reliable, we do not assume responsibility for its accuracy.
The views expressed herein are solely those of Bridgewater as of the date of this report and are subject to change without notice. Bridgewater may have a significant financial interest in one or more of the positions and/or securities or derivatives discussed. Those responsible for preparing this report receive compensation based upon various factors, including, among other things, the quality of their work and firm revenues.