
Research & Insights

We are in a new geopolitical and macroeconomic paradigm. For decades, globalization—characterized by rising trade and capital liberalization—defined the world order. That era is over. In its place is emerging what we call “modern mercantilism,” where national self-interest takes precedence over global cooperation. While this transition has been underway for years, it has now sharply accelerated. A global system of interdependence, built since the dawn of the US-led postwar era, is unraveling. Explore a selection of our insights.

We are now in a radically different macroeconomic environment—one that poses urgent challenges to markets and portfolios. Today’s mix of global assets reflects the winners of the past paradigm. As a result, many portfolios are more vulnerable than ever to slowing growth, an equity bear market, or US underperformance. They are also geographically concentrated and increasingly illiquid—with little protection against inflation. In short, they are not resilient. Explore a selection of our insights.

Since the development of our first investment systems decades ago, Bridgewater has been at the forefront of using technology to go beyond human capabilities. Today, we are in the midst of a once-in-a-generation technological disruption, unfolding alongside profound shifts in the macroeconomic and geopolitical landscape. Artificial intelligence is already influencing markets and reshaping the economy—and this is just the beginning. Explore a selection of our insights.
Selected Insights from Our Research Library

July 16, 2026
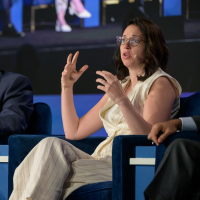
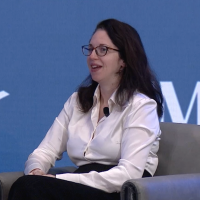
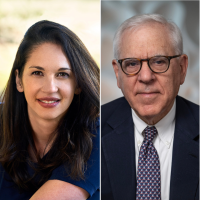
In an excerpt from our Q2 CIO call, Karen Karniol-Tambour lays out where we stand today in the new paradigm shaped by modern mercantilism and AI, and describes what investors can do to navigate this environment.

May 19, 2026
Energy expert Dan Yergin joins Bridgewater’s Atul Lele, Head of Portfolio Strategists, and Ian Singer, Head of Commodities, to unpack the return of energy security and how the AI build-out will be powered.

May 3, 2026
At the Milken Institute's 2026 Global Conference, Co-CIO Karen Karniol-Tambour discusses the investment implications of a world increasingly organized around resilience, industrial policy, and competing economic ecosystems.

April 22, 2026
In an excerpt from our Q1 CIO call, Greg Jensen describes how modern mercantilism and AI are driving two accelerating resource grabs and what that means for navigating markets and portfolios today.

April 15, 2026
At the HSBC Global Investment Summit 2026 in Hong Kong, Co-CIO Bob Prince joins HSBC Private Bank CEO Ida Liu to discuss managing money in a global landscape being reshaped by modern mercantilism and AI, as well as Asia’s role in providing diversification to today’s portfolios.

January 14, 2026
In an excerpt from our Q4 CIO call, Karen, Greg, and Bob describe the new investment regime—defined by AI and modern mercantilism—and share how investors can build a resilient portfolio in the current environment.

January 7, 2026
We believe AI capex is set to significantly support US growth in the coming years and that many of the second-order consequences of this investment are not priced in.

November 26, 2025
Co-CIO Greg Jensen joins Nicolai Tangen, CEO of Norges Bank Investment Management, to unpack the geo-political and economic impact of modern mercantilism, the global AI race, and how Bridgewater is building for the future.

November 26, 2025
Quick thoughts from co-CIO Greg Jensen and AIA Labs Chief Scientist Jas Sekhon on the release of Google’s Gemini 3 model and its implications for economies and markets.

November 13, 2025
As countries grapple with the US’s more mercantilist trade policy, Canada offers a window into how different economies may respond to these pressures.

October 31, 2025
Throughout our history, the Daily Observations—or what we call “the wire”—has been our way of giving our clients and policymakers a real-time view into how we’re processing the world. In celebration of Bridgewater’s 50th year, we’re sharing a selection of BDOs that highlight the people, ideas, and process behind that pursuit.

October 16, 2025
Cheap, abundant electricity is critically important to the AI race and national competitiveness. We take stock of energy supply and security across the US, China, and Europe.
October 14, 2025
As modern mercantilism accelerates and the AI revolution unfolds, the forces shaping today’s markets are testing the economic balance. In this excerpt from our Q3 call, Co-CIO Bob Prince shares his perspective on what this means for investors navigating a world moving away from equilibrium.
October 6, 2025
With gold up around 50% year-to-date and recently rising above $4,000 an ounce for the first time, investors are asking what’s driving the move. In this recent conversation, Bridgewater senior investors unpack the dynamics behind the rally and some of the questions it raises, including whether the rally is sustainable.

September 22, 2025
The resting heart rate of inflation looks higher than it did pre-pandemic, with 2% more a floor than a ceiling. Investors face structurally higher inflation risks, and most portfolios remain poorly equipped to manage them.

July 2, 2025
Without more domestic manufacturing, tariffs are likely to result in lower margins and higher prices. In Part 1 of this series, we explore the structural pressures that make growing US manufacturing so challenging.

July 10, 2025
Increasing US manufacturing will require increasing manufacturing productivity. We explore the existing technologies that can be transformative for US productivity, and what it will take for them to be applied at scale.
June 30, 2025
Bridgewater’s Jim Haskel sits down with WTW’s Jon Pliner and Mercer’s Rich Nuzum to discuss the risks they see in asset allocations today and how investors can protect help their portfolios.
June 18, 2025
Co-CIO Greg Jensen shares his thoughts on how modern mercantilism—including trade policy, geopolitical risk, and capital flows—is progressing, our outlook for the US economy, building resilient portfolios in this environment, and more.

April 21, 2025
In this edited version of our Q1 CIO call, Co-CIO Karen Karniol-Tambour describes how we are processing today’s radically different economic and market environment.

April 3, 2025
Head of the Portfolio Strategist group Atul Lele joins the Fiduciary Investors Symposium in Singapore to discuss the paradigm shift from globalization to modern mercantilism, and how investors can construct resilient portfolios in today’s increasingly complex macroeconomic and geopolitical environments.

March 19, 2025
Policy has shifted to prioritize energy security and industrial competitiveness over climate leadership. This will steer investment to the most economical energy sources, driving continued growth in renewables and fossil fuels—but slower decarbonization.

March 10, 2025
For decades, America has consumed much more than it produces, financing persistent trade deficits with debt that foreign investors are happy to buy. President Trump is unwilling to accept this state of affairs. In a guest essay for the New York Times, co-CIO Karen Karniol-Tambour describes what this shift means for Europe’s economic and security paradigm, the changes that are needed, and the barriers to reform.
March 4, 2025
Daily Observations editor Jim Haskel sits down with head of contra-currencies Hudson Attar and portfolio strategist Alex Smith to discuss the recent gold rally and the type of diversification gold can provide.
February 6, 2025
Energy expert Daniel Yergin sits down with Bridgewater senior portfolio strategist Atul Lele to discuss supply and demand dynamics across energy markets and their implications for investors.

January 30, 2025
Co-CIO Bob Prince discusses the gradual drift of economic conditions toward equilibrium and whether this process has room to run.

January 6, 2025
With central banks on the verge of achieving their goals—supporting stability, profits, and asset prices—global political shifts risk upsetting the balance. Our CIOs describe these dynamics and what they mean for investors.

November 21, 2024
Following Trump’s victory, we assess the supply and demand picture for US debt, and what it means for yields going forward. To do so, it is important to look at the total debt in the economy—not just government debt.

November 12, 2024
At the recent Yahoo Finance Invest conference, Co-CIO Karen Karniol-Tambour shared her thoughts on what’s next for growth and inflation, Fed policy, the impact of Trump’s policy agenda, and how we’re processing the flow-through to markets. See Important Disclosures and Other Information.

October 16, 2024
Where is AI today, and where is it going in the near future? In this video presentation, Bridgewater’s AIA Labs Chief Scientist Jas Sekhon provides a framework that can help answer those questions and resolve a key paradox that currently exists in the AI landscape.

October 3, 2024
Head of Client Service and BDO Editor Jim Haskel speaks with Bridgewater founder and CIO mentor Ray Dalio aboard his OceanXplorer ship in Singapore about the five big forces that shape history and markets and how they’re playing out today.

September 25, 2024
In a moderated conversation, Rohit and Bob discuss how they each approach portfolio resilience at their respective organizations and the potential opportunities they see in markets today.

September 17, 2024
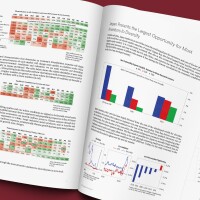
Some of the largest drivers of US equity outperformance cannot be counted upon going forward. A lot depends on the ability of US tech to deliver and AI to unleash productivity across sectors.
September 2024
As part of the 30th anniversary of the relationship between Bridgewater and GIC, the entity that is responsible for managing Singapore’s international reserves, our two organizations have led a series of joint research projects to identify and assess the issues we think are most important for investors to grapple with in the years ahead. In this videocast, Head of Client Service and Editor of the BDO Jim Haskel discusses the takeaways of that work with Jeffrey Jaensubhakij, Group Chief Investment Officer of GIC; Liew Tzu Mi, Chief Investment Officer for Fixed Income & Multi Asset and Chair of the Sustainability Committee; and our own co-Chief Investment Officer Greg Jensen.

September 10, 2024
Co-CIO Greg Jensen explains that the greatest bubbles require a transformational technology and a ripe macro and monetary backdrop. We now have both—so he believes the AI bubble is ahead of us, not behind us.
August 14, 2024
Ajay Banga, President of the World Bank, sits down with Bridgewater CEO Nir Bar Dea to discuss Africa’s economic trajectory and how it creates challenges and opportunities for global investors.
August 2024
The demographic boom in the working-age population in sub-Saharan Africa is one of the long-term forces that can shape the world in the coming decades. In this research, we explore this dynamic in depth, its implications for the region’s role in the global economy, and how decisions made by policy makers, investors, and the private sector can forge alternative paths.
August 23, 2024
The CIO of Australia’s sovereign wealth fund, managing $300 billion AUD, joins us for a conversation on their total portfolio approach and some of the most challenging questions facing investors.

July 7, 2024
Co-CIO Karen Karniol-Tambour recently joins Alex Shahidi on the latest episode of his podcast, The Insightful Investor, to share insights into her professional journey, Bridgewater's current market outlook, and how to think about building great portfolios in this environment.

June 24, 2024
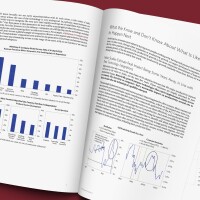
Co-CIO Karen Karniol-Tambour describes how we’re in the midst of a transition from an exceptionally low cost of capital to more moderate levels. But bond yields still need to rise to set a price of capital that is sustainable for the world we’re in, compensating for structurally higher fiscal stimulation and inherently inflationary spending on things like AI investments, remilitarization, rebuilding supply chains to reduce reliance on China, the energy transition, and energy security.
June 18, 2024
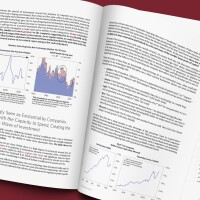
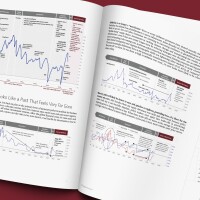
Throughout history, certain companies have dominated the equity market, but co-CIO Bob Prince explores how the process of creative destruction makes staying on top for long periods of time very difficult.
May 20, 2024
While AI investment isn’t yet a major driver of economic growth, co-CIO Greg Jensen says it looks poised to rise rapidly from here—with the potential to shape the business cycle well before AI is in widespread productive use.
May 7, 2024
At the Milken Institute’s 2024 Global Conference, co-CIO Karen Karniol-Tambour shares her thoughts on the macro outlook, touching on where to find geographic diversification, how we’re approaching geopolitical risk, the impact of AI on inflation, and more.

April 25, 2024
As most major economies are seeing their working age populations stagnate or shrink, sub-Saharan Africa’s is growing rapidly and projected to be larger than China’s in about a decade. If the region can also increase its productivity growth, it will begin to emerge out of poverty and gradually become relevant to global investors.
April 18, 2024
Bridgewater co-CIO Karen Karniol-Tambour joined a panel conversation at Semafor’s first World Economy Summit to discuss the evolving macroeconomic environment, fiscal policy, the bond market, demand for U.S. assets, and the strength of the U.S. dollar.
April 1, 2024
Head of Sustainability Research Daniel Hochman and Senior Researcher Jeremy Ng explore how achieving the world’s ambitious climate goals will require rapidly scaling economically viable technologies, while also innovating, incentivizing, and investing in less mature technologies that are not yet cost-competitive.
February 23, 2024
Maximizing the benefits of geographic diversification can be highly beneficial for portfolios. But doing so can be difficult because many economies are closely linked to US conditions, making their markets highly correlated to US assets investors already own. Co-CIO Karen Karniol-Tambour explores some of the markets she sees as the most diversifying.
February 22, 2024
Bridgewater alum, author, and investor Paul Podolsky shares how he’s assessing Russia and its threat to the global order following the death of Alexei Navalny, what it takes for economies to succeed in the modern world, and the implications for investors.
January 3, 2024
The secular investment landscape looks more like decades past than the last 20 years, while dynamics like AI and climate change will likely shape the world in unprecedented ways. Co-CIO Karen Karniol-Tambour describes this new era of investing.

November 30, 2023
What happens when cognitive tasks can be done at zero marginal costs? Co-CIO Greg Jensen explores some of the potential impacts that advancements of AI/ML technology could have on companies and the economy, including an extreme scenario that could potentially produce “explosive growth.”
October 2, 2023
The impacts of AI on the economy will depend both on how the technology evolves and how quickly and effectively it is implemented. Co-CIO Karen Karniol-Tambour shares how we are interpreting the growing literature on the topic and tracking the process in real time.
September 20, 2023
Bridgewater co-CIO Karen Karniol-Tambour joins “Bloomberg Wealth with David Rubenstein” for a wide-ranging discussion on Bridgewater’s current leadership and culture, her career journey, and our outlook on markets and economies.
November 30, 2022
The publicly traded firms in a handful of emissions-intensive sectors are responsible for about 60% of all global emissions. By allocating capital to climate solutions and carbon improvers in these sectors, investors can make progress toward their net zero goals, even if that leads to higher spot portfolio emissions than if they were to cut these emissions-intensive sectors altogether.
Featured Research
We are constantly monitoring present day events and drawing lessons from history to shape and refine our understanding for how markets and economies work. Explore a collection of our research on topics ranging from modern mercantilism to sustainable investing.


