

The pandemic and the shutdowns that followed have opened two distinct but related holes—a hole in incomes (the real economy), and a hole in asset markets. If left unfilled, these holes would produce a self-reinforcing collapse and intolerable economic and social outcomes. The longer they persist, the greater the accumulated problems and the higher the likelihood of prolonged economic weakness as households and businesses sell assets and eat through cash balances until more and more entities are bankrupt. Faced with this, the main policy choice is whose balance sheets will bear the losses, which will determine to some extent how the economy rebounds after the health emergency eases. Many policy makers are now attempting to use government balance sheets to fill these two holes through coordinated monetary and fiscal policy (MP3)—filling the gap in markets with the central bank balance sheet through QE, and filling the gap in incomes with the government balance sheet through fiscal stimulus monetized by that QE. The intent is to avoid a collapse in markets and to bridge the gap in incomes so that when the pandemic is over companies are still intact, workers can get back to work, and the economy can quickly get back on its feet. In other words, policy makers hope to reduce the impact of the pandemic to a short-term interruption in activity and avoid long-term economic problems.
While this approach makes sense to us, it is far from assured that policy makers will be able to get what they want. The unique nature of this downturn—a collapse in income (as opposed to credit) at the same time as a global supply shock—makes filling the financial hole much easier than filling the economic hole, which risks decoupling financial markets from the underlying real economy. That is starting to happen, and it is likely to continue in the short term. So while our corporate loss and growth impact estimates are significantly more negative than consensus, we are (cautiously) bullish financial assets in places where the liquidity is likely to flow. But a gap between the markets and the economy can’t grow forever, and it will eventually have to be reconciled. The two ways it could be reconciled are through either a fall in prices (so poor nominal returns) or inflation that raises nominal cash flows despite a weak underlying real economy (so poor real returns). If history is any guide, policy makers tend to pursue the inflationary path, as the pain is less visible and can be spread out over time. And the secular debt and demographic challenges that pre-dated the virus create an underlying pressure to push MP3 policies as far as they can go. But there are limits, and those limits will be reached when inflation and/or currency weakness reach unacceptable levels.
Of course, countries vary a lot in their ability to pursue MP3 and how soon they will encounter limits. In the US, reserve currency status and the global need for dollars have allowed policy makers to push hard without producing currency weakness, but it’s here that the gap between assets and the economy is arguably the biggest, with stocks at this point in positive territory year over year. In other words, even the “good” outcomes being produced in the countries with the most capacity to run deficits funded by money printing are coming at a price. These dynamics set up a wide range of possible outcomes: while there is still a risk of a deflationary stagnation if stimulus is pulled back too soon, the policy push increases the risk that we hit a secular turning point in inflation in places where the ability to use MP3 is the greatest.
The Coronavirus Shock, and Replacing Income with Money
The nature of this crisis and the policy response is very different than in past downturns. As we’ve said, the most useful lens for understanding what is happening and what may transpire is to view things in terms of the sources and uses of funds. There are three broad sources of funds—money, credit, and income—and there are three broad uses of funds—spending on goods and services, purchases of financial assets, and the parking of excess liquidity in reserves at the central bank. These sources and uses are two sides of the same transaction, so just as debits equal credits, sources equal uses.

Downturns typically occur through a collapse in credit: a tightening of monetary policy occurs through a rise in interest rates, which constrains the growth of credit, which reduces spending, which reduces incomes, which reduces spending, and so forth. In addition, the reduction in credit and the reduction in incomes reduces the cash flows and purchases of assets, which lowers their value and price. Even in extreme cases (e.g., the 2008 financial crisis), this is fairly easy to offset from a mechanical perspective: central banks can step in and produce money to replace lost credit. And this isn’t inflationary, as long as central banks are simply offsetting the deflationary force of the collapse in credit.
This downturn is different: we have an immediate, global collapse in incomes due to the global shutdown, which is producing a self-reinforcing collapse in spending. And that collapse in income is happening at the same time as a collapse in supply due to businesses that are closed or operating with reduced capacity and the disruption of global supply chains.

Governments are stepping in to replace lost income, financed by credit (e.g., bond issuance). We’ve represented this as the direct action (1), the desired effect of that (2), and the secondary effect of that (3), which is what is required to get the self-reinforcing flywheel of spending and incomes turning faster and faster (i.e., growth, which is progressively higher levels of incomes and spending).

At the same time, central banks are increasing money to support asset prices and effectively finance government spending, preventing an undesirable rise in interest rates due to the new issuance. They hope that the funds from these purchases will find their way through the system to support other assets that they are not directly buying and ultimately support spending, which would support incomes.

The problem is that the QE channel is a fairly direct stimulant to asset prices, whereas the flow-through of both the fiscal stimulus it is financing as well as the QE itself to actual spending is more tenuous. Households will spend on essentials, but many people are still confined to their homes and many businesses are still closed, and even after the lifting of lockdowns and stay-at-home orders, spending will likely be constrained until the broad availability of a vaccine. Put simply, no amount of stimulus by itself is going to get people out of their homes and into restaurants, movie theaters, hotels, etc.
At the same time, the magnitude of the holes that need to be filled is massive and growing, creating pressure for policy makers to do as much as they can with the tools that they have. If not offset by policy measures, we estimate that globally the economic shock would lead to $26 trillion of decreased revenue for companies in 2020, with correspondingly huge hits to growth across countries. The table below summarizes what policy makers are up against and how they are responding. We show our estimates of the hit to corporate revenues as a percent of GDP, followed by the growth drag of the shutdown over the next year. Next we show the headline fiscal stimulus response (i.e., the raw size of the announced programs). The stimulus won’t flow through to spending dollar for dollar, as the impact depends on the nature of the stimulus (e.g., who is getting direct payments and their likelihood of spending them); the next column shows our estimate of the impact, coming out of our Government Impact on Growth (GIG) process, in which we granularly track the announced programs and model their likely impacts. The sum of the growth drag (first red column) and the stimulus impact (green column) is the net growth impact—our final estimate of the drag on growth over the next year. We’ve ordered the table by the results in this column, worst to best. Finally, we show the QE that is now occurring nearly everywhere.

The differences in both the impact of the shutdown and the policy responses across countries are stark. In many countries, policy makers have responded quickly and in force. We are now in the midst of the largest global money printing since quantitative easing became a regular tool in policy makers’ toolboxes. Many countries are running historic budget deficits—the US, which has had one of the most robust policy responses, is on track to run a deficit of a magnitude not seen since World War II. On the other hand, countries less able to use MP3 due to lack of independent monetary and fiscal policy (e.g., Italy, Spain) or the immediate risk of further currency weakness and/or inflation (e.g., Turkey, South Africa) are facing catastrophic declines in activity.

The Growing Disconnect Between Assets and the Underlying Economy
In addition to the hole in incomes, the pandemic opened a hole in markets. The sudden loss of incomes created a squeeze for cash and a need for capital at the same time as increased uncertainty and worsening economic prospects made investors less inclined to part with their capital and take risk. The ensuing pullback caused a decline in asset prices and a rise in borrowing costs. If left unchecked, this squeeze would become self-reinforcing, as asset sales and higher borrowing costs worsen balance sheets and encourage a further move to cash. The knock-on effects on liquidity, solvency, and wealth would exacerbate the ongoing growth problems. The market action in mid-March, where virtually all assets sold off together, was an acute example of what happens if the hole in markets is allowed to become too large.
Given this risk, central banks (most notably the Fed) have stepped in and have been filling the hole in markets with printed money. So far, this has kept the financial system liquid, kept bond yields low despite the massive increase in government borrowing, capped/reversed much of the rise in credit spreads, and produced a broad reflation in asset prices. This has mostly prevented the markets from exacerbating the growth problems.
But while money printing can fill the hole in markets, it has the potential to create a disconnect between the pricing of assets and the economy. Ultimately, assets are claims on future cash flows. Money printing can push up asset prices but it doesn’t directly create the demand for goods and services that drives those cash flows. That demand comes only indirectly, when buying assets with printed money drives down their yields and pushes up their prices, creating second-order incentives to borrow and spend. But that transmission mechanism is now impaired. Bond yields are near zero and can’t fall much further; shutdowns make it difficult to stimulate borrowing and spending; and financial asset holdings are concentrated in wealthier households with a lower marginal propensity to spend, limiting the impact of pushing up their prices. Of course, the limited effectiveness of QE alone is what has created the need for MP3—direct government spending essentially financed by QE. But for the reasons already described, in this environment of lockdowns and social distancing requirements the ability of the current income-replacement policies to flow through to spending and production is likely impaired as well.
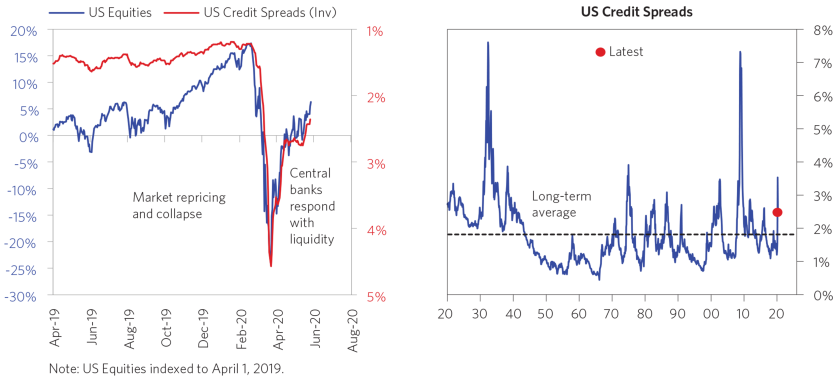
In the places where MP3 is being pushed most aggressively, the recovery in financial assets looks to us to have outpaced the recovery in the economy—but the need for continued MP3 and the overwhelming impact of QE on markets mean that this is likely to continue. Below, we show the performance of US equities and credit spreads over the past year; as shown, after the collapse in March, equities are now above where they were a year ago. While lower bond yields mean that equities are discounting a somewhat more pessimistic scenario, given the size of the economic hit this is fairly remarkable. With respect to credit spreads, while there is a tail of companies for whom a high probability of default is now priced in, for the majority of companies spreads are only modestly elevated relative to longer-term historical norms. For now the Fed is able to get what it wants, and is largely getting it.
At the same time, even with the overwhelming policy response we’ve seen in the US, the underlying economic reality is fairly dire, and our guess is worse than consensus estimates. In the left chart below, we show our GDP estimates for the US over the next year, with the blue line representing our rough base case and the green and red lines a plausible range around that, based on the potential medical and policy responses. Our base case is that the US economy will still be at below pre-virus levels of activity in a year, with activity only slightly above pre-virus levels in what we would consider the best-case scenario. The chart on the right shows that the GDP drawdown we are estimating is huge by historical standards. Of course, we could be wrong in our estimates, but to us it looks like the US market recovery is now being driven much more by the wave of printed money than it is by an improvement in the economic fundamentals.

Ongoing Secular Pressures Make It Likely That Monetary Policy 3 Is Here to Stay
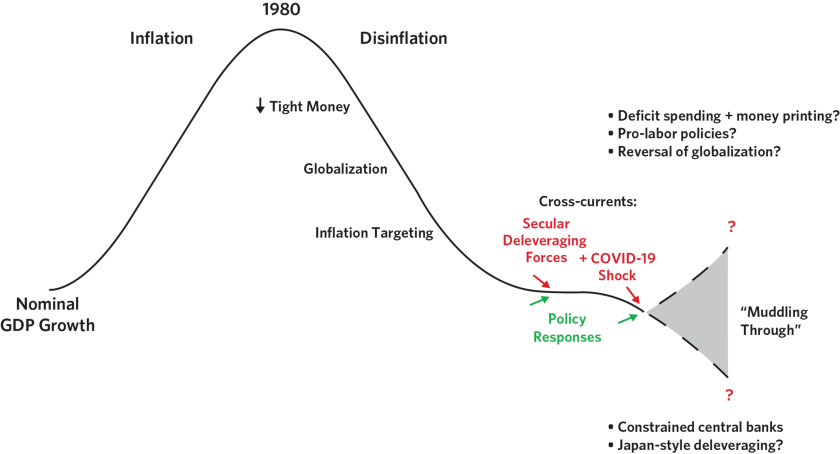
Much like QE was initially seen as a temporary and extraordinary response to the financial crisis but over time became the new normal, we expect that MP3 is here to stay and will likely remain well after the virus is behind us. In addition to the second-order economic consequences of the virus that make a quick recovery unlikely and will likely take some time and require ongoing stimulus, the secular forces that were creating the need for a new policy paradigm have only been exacerbated. But there is risk that the core dynamic that was creating the ability for MP3—persistently low inflation despite extremely easy policy—is far from guaranteed going forward, in part because a decade’s worth of MP3 has already occurred in a matter of months.
Heading into the new decade, we described the need for a new policy paradigm. That shift was being driven by a confluence of secular pressures, each of which has been exacerbated by the pandemic. Central bank policy was near the limits of its effectiveness, and with the policy response to the pandemic, MP1 (interest rate policy) and MP2 (QE) are now largely exhausted. Our fuel in the tank measure incorporating both MP1 and MP2 is shown below. The crisis is also widening divisions and intensifying pressures for internal and external conflict. And historically large government deficits to backstop private entities are adding to an already massive pile of IOUs in the form of debt, pension benefits, healthcare and social security benefits, etc. This is worsening the “big squeeze” that was already underway, as incomes are likely to fall far short of what will be required to service these obligations (even before the crisis, the total size of IOUs in the US was likely to reach roughly 11x GDP over the next decade, and now this will likely be materially worse).

These forces create an underlying pressure for policy makers to push MP3 policies as far as they can. The big squeeze is a direct downward pressure on asset prices, since assets will have to be sold in order to meet liabilities that come due. Before the crisis, this selling was being offset to a significant degree by corporate buybacks of equities; but with corporations rapidly becoming much more indebted, buybacks will likely be much smaller. Looking ahead, this dynamic could produce a world where assets will fall unless central banks buy them. Ultimately, the only way out of this situation is to produce sufficient real growth to finance the obligations, or to erode the real value of obligations through inflation. The former is a possibility, though absent a productivity miracle it’s difficult to see where the real growth would come from. But either way, these pressures argue for keeping MP3 in place as long as is tolerable.
Even before the pandemic, secularly low inflation was already leading policy makers to run very easy policy and to prioritize stimulating growth over proactively tightening to fight inflation. Prior to the crisis, despite a decade of money printing and the recovery in the economy, inflation remained persistently below central bank targets (chart on the left below). Inflation had become less cyclical: in the chart on the right below we show the most cyclical part of inflation, cyclical services inflation, against the unemployment rate (inverted) as a measure of the strength of the economy. Normally a rising economy (the red line) would lead to a rise in inflation, but over the last decade that relationship has broken down under the weight of secular deflationary forces.

The lesson was that central banks could remain extraordinarily easy, and that even with a strengthening economy inflation risk was not a concern. And over the past decade, countries that ran the easiest policy and had the biggest fiscal spending had the best economic and market outcomes. The attempt to “normalize” policy at the end of 2018 and the outsize impact of that tightening prompted a shift in policy to take advantage of this lesson. Rather than being forced to tighten preemptively to head off a cyclical rise in inflation, policy makers could prioritize growth outcomes and run easy policy. So we thought 2018 was likely to be the last preemptive tightening we would see for a while, and over time we expected policy makers would—and should—gradually experiment with new forms of policy and ultimately MP3.
Then the pandemic happened, and the shift we thought would play out over many years happened in a matter of months, in circumstances quite different from what we anticipated. In the context of the challenges of the past decade, secularly low inflation presented an opportunity to stimulate, and policy makers eventually internalized that lesson. Now in response to the pandemic they are running one of the largest coordinated monetary and fiscal stimulus pushes in history. But given the unique nature of this downturn—where printed money is replacing incomes while supply is likely to remain constrained for some time—there is real risk that the lesson of the last decade is misleading.
A Wide Range of Potential Outcomes, with Increased Odds of an Inflationary Turning Point in Economies Where MP3 Is Available
There continues to be a wide range of possible outcomes across countries and a growing likelihood that different economies will follow different paths. Even where the policy response has been big so far, there is still a real possibility of deflationary depression if the underlying medical situation takes a turn for the worse, or if there proves to be a duration mismatch between the policy response and the economic hole that has been created and policy makers pull back from stimulus too soon.
For now, it looks likely that policy makers in developed economies will push as hard as they can to stimulate (though the pre-existing limits in Euroland are making this difficult there, with potentially catastrophic consequences for the EU). As long as fiscal-monetary coordination helps produce positive economic outcomes, there will be a temptation to continue.
Longer-term, policy makers will be tempted to test the limits of the new paradigm. Just as interest rates (MP1) and quantitative easing (MP2) have limits, MP3 has limits as well, which will be hit when deficit spending financed by money printing produces unacceptable inflation and/or currency weakness. Different countries will hit this wall at different rates, based on the demand for saving in their currency, with reserve currencies like the US likely to hit the wall later.
As economies reopen, there is a decent chance we will see inflation start to materialize. The economy will still be weak and in need of stimulus, and the massive pile of money that has been printed will start to make its way into spending at a time when supply will be significantly impaired, all the way from supply chains that will take time to recover (and in some cases will be rebuilt domestically) to fewer tables at restaurants with social distancing measures in place. And we’re already seeing evidence of inflation in less elastic consumer goods and services like food and healthcare. The deflationary forces are large, and could win out; but what is most clear is that inflation stats will be hard to interpret, there is a high enough risk that inflation spikes, and in the event that it does it will be easy to dismiss as transitory and an artifact of an extraordinary environment.
So while we are prepared for a wide range of outcomes and are measuring what path we are on (which is hard enough) versus predicting where we are headed, to us the odds have increased that we hit an inflationary turning point in economies that are able to use MP3. In other words, where policy makers have the choice, the gap between financial assets and the underlying economy will more likely be resolved through inflation (and poor real returns) than a collapse in prices and poor nominal returns. But this can’t go on forever. We are starting to visualize and prepare for what it will be like when the limits are reached—the day that policy makers can no longer get what they want.
This research paper is prepared by and is the property of Bridgewater Associates, LP and is circulated for informational and educational purposes only. There is no consideration given to the specific investment needs, objectives or tolerances of any of the recipients. Additionally, Bridgewater’s actual investment positions may, and often will, vary from its conclusions discussed herein based on any number of factors, such as client investment restrictions, portfolio rebalancing and transactions costs, among others. Recipients should consult their own advisors, including tax advisors, before making any investment decision. This report is not an offer to sell or the solicitation of an offer to buy the securities or other instruments mentioned.
Bridgewater research utilizes data and information from public, private and internal sources, including data from actual Bridgewater trades. Sources include the Australian Bureau of Statistics, Bloomberg Finance L.P., Capital Economics, CBRE, Inc., CEIC Data Company Ltd., Consensus Economics Inc., Corelogic, Inc., CoStar Realty Information, Inc., CreditSights, Inc., Dealogic LLC, DTCC Data Repository (U.S.), LLC, Ecoanalitica, EPFR Global, Eurasia Group Ltd., European Money Markets Institute – EMMI, Evercore ISI, Factset Research Systems, Inc., The Financial Times Limited, GaveKal Research Ltd., Global Financial Data, Inc., Haver Analytics, Inc., ICE Data Derivatives, IHSMarkit, The Investment Funds Institute of Canada, International Energy Agency, Lombard Street Research, Mergent, Inc., Metals Focus Ltd, Moody’s Analytics, Inc., MSCI, Inc., National Bureau of Economic Research, Organisation for Economic Cooperation and Development, Pensions & Investments Research Center, Renwood Realtytrac, LLC, Rystad Energy, Inc., S&P Global Market Intelligence Inc., Sentix Gmbh, Spears & Associates, Inc., State Street Bank and Trust Company, Sun Hung Kai Financial (UK), Refinitiv, Totem Macro, United Nations, US Department of Commerce, Wind Information (Shanghai) Co Ltd, Wood Mackenzie Limited, World Bureau of Metal Statistics, and World Economic Forum. While we consider information from external sources to be reliable, we do not assume responsibility for its accuracy.
The views expressed herein are solely those of Bridgewater as of the date of this report and are subject to change without notice. Bridgewater may have a significant financial interest in one or more of the positions and/or securities or derivatives discussed. Those responsible for preparing this report receive compensation based upon various factors, including, among other things, the quality of their work and firm revenues.