

What comes next is weak economies and tough policy choices.
Going back before going forward, in 2020-21, aggressively applied MP3 policies stimulated a high level of nominal spending growth that was well in excess of the output capacity of labor, with the difference between them producing a self-sustaining, monetary-induced inflation. In 2022, recognition of this condition led markets to discount a coming rise in interest rates and tightening of monetary policy. The Fed and central banks then followed suit. The speed and magnitude of the tightening has been severe, among the sharpest in the past 60 years. The primary effect of this tightening has been to drive asset yields higher to compete with the higher yield on cash, which drove prices lower through the present value effect. That is pretty much the full explanation for this year’s weak asset markets.
The effect of this tightening on economies has been far less, though not enough time has passed to expect a lot. The effects are coming, and they must come in order for targeted levels of inflation to be achieved. Therefore, the next stage of the tightening cycle is likely to be a significant slowing of economic activity, probably a downturn. Whether the weakening of the economy sufficiently lowers inflation to central banks’ target levels and to the levels that are now discounted in the markets depends on the degree of economic weakness and how long that weakness lasts. And in particular, whether there is a contraction in employment and a material rise in the unemployment rate.
The key linkages are as follows. Inflation is too high because nominal spending growth is far greater than the ability of labor to produce more output. This is amplified a bit by supply issues, but supply is not the problem. Sustainably reducing inflation will require cutting nominal spending growth by about half to around 3% to 5%, which is where it was during the moderate inflation period of the 2000s and 2010s. While this high level of spending growth was initially financed by government credit and money printing, it is now financed by the income that the spending is producing. In other words, it is self-financing via the income that the spending produces, which is the second stage of a monetary-induced inflation.
So, how does a tightening of monetary policy break the cycle? It does so through a number of channels. First, higher interest rates directly reduce debt-financed spending, such as housing and autos, which incrementally reduces income. This has already happened via mortgages and housing, but housing and housing-related spending is too small to be the solution. Second, the rise in interest rates, through the present value effect, lowers asset prices, which reduces wealth, which typically raises the savings rate, which means less spending and less income. Third, higher interest rates and a tightening of credit conditions reroute income from spending to debt service payments. Fourth, income is reduced directly via a contraction in hours worked, a contraction in labor markets. Given the high level of nominal spending and the degree to which it has passed through to wage growth, this fourth lever will be required.
For the tightening to sustainably reduce inflation will require significant impacts on labor income. Labor income is the sum of two parts, hours worked (dominated by headcount) and wages per hour. The tightening will have to first produce a contraction in the number of people working and raise the unemployment rate by enough and for a long enough period of time to reverse the supply/demand imbalance for labor sufficiently to lower the price of labor, i.e., wages. Only after wage growth slows will inflation stabilize at the levels that central banks want and that the markets are discounting.
Up to this point, the appropriate policy response to the environment has been clear, though it came too late. Strong growth and the emergence of a self-reinforcing, high level of inflation required a tightening. Going forward, the policy choices will be far more challenging when the goals of full employment and stable prices are at odds and the contraction in employment has not been sustained for long enough to bring down wage growth. For most central banks, at that stage there is a tendency to pause and see how things transpire. Such a pause tends to give markets a celebratory reprieve, producing a period of very good asset returns and a pickup in growth, both of which conspire to prevent wages and inflation from settling at the desired level, which necessitates the next round of tightening.
A near-term economic downturn, an extended period of above-target inflation, and a second round of tightening are not discounted in the markets at all. What the markets are now discounting is that the first round of tightening is nearly over, that growth will not slow much and yet inflation will quickly fall to desired levels and that this will allow a cut in interest rates in 2023 and 2024 that restores a normal risk premium in bonds. There is a lot of room for markets to be blindsided by what we see as the normal sequence of events which typically follows the conditions that exist today.
This description of conditions is applicable to the US, Europe, the UK, and other developed economies which countered the pandemic via MP3 policies, which boosted incomes via the monetization of government debt. In contrast, conditions in China, Japan, and other economies which resisted this path and instead chose the path of more severe social adjustments are quite different. In those countries, nominal spending growth is at normal levels, which is producing normal inflation rates, which is giving policy makers more latitude to counter economic weakness with stimulative policies that can be executed via combinations of monetary policy, fiscal policy, and macroprudential regulatory policy. China is applying some of that latitude while trying not to overdo it. Japan is sticking with their QQE policies and the targeting of bond yields while experiencing near 2% inflation rates for the first time in years. These more accommodative policies are in contrast to the severe tightening by the Fed, weakening these countries’ exchange rates but stabilizing their asset markets in local currency terms.
Below, we will try to succinctly elaborate on this unfolding story via a brief series of illustrations and charts.
Illustrating the Dynamics at Work
There are two big imbalances that must be resolved to achieve equilibrium conditions. Nominal spending growth is far higher than the output capacity of labor, and nominal spending is also far higher than interest rates. The first condition is why inflation is high; the second condition contributes to the ability of credit growth to sustain the high level of nominal spending until a rise in interest rates is sufficient to bring the level of nominal spending down, converging at a reasonable balance. The following charts illustrate these two disequilibriums.

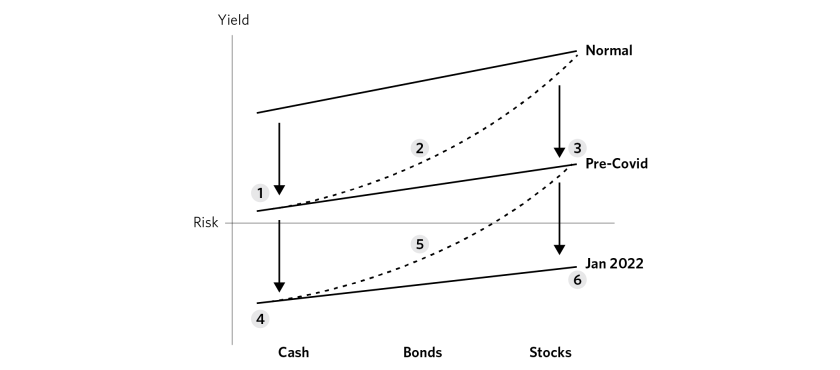
Asset prices are down this year because asset yields are up, and asset yields are up because the aggressive tightening of monetary policies has driven up the discounted future real yield of cash, which we call the discount rate. The discount rate is the base reference by which all assets are ultimately compared because holding cash is an alternative to holding risky assets. There is a risk curve which is like a yield curve across assets, which reflects the required yield on other assets as risk increases. The following illustration shows how over the past decade central banks managed a progressive decline in the discount rate in stages (1) and (4), which led to the decline in yields on other assets, steepening the risk curve (2) and (5), which induced money to move from cash to assets (3) and (6), driving their yields down. That was the basis of very high returns on assets over this period.
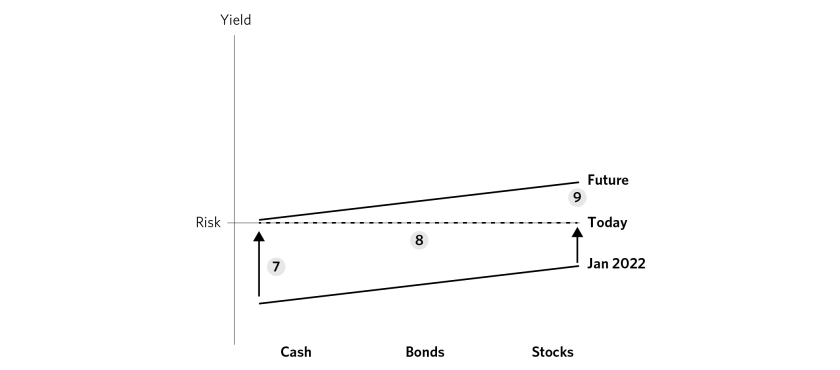
This year’s tightening has reversed that process by driving the discount rate up (7), flattening the risk curve (8), requiring higher yields on all assets (9).
Given these conditions, there has been a reversal in the long-term downtrend in discount rates and real bond yields. This rise in real yields has passed through all assets and supported the dollar relative to gold and other currencies.

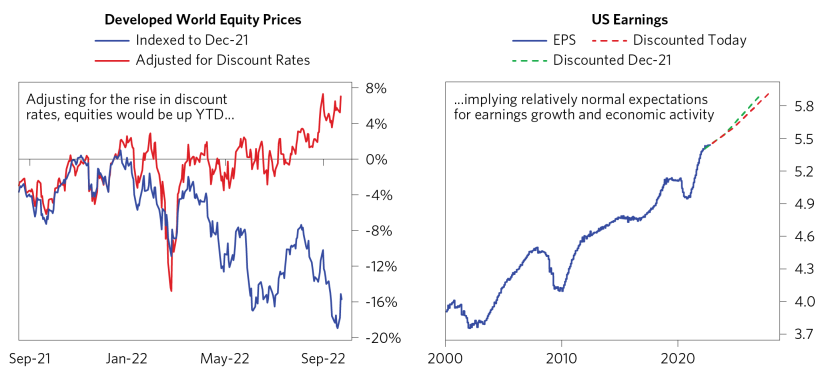
If you adjust recent equity returns for the portion that is attributable to the rise in discount rates, they are not down. In other words, there has been no discounting of a decline in future earnings. This is corroborated by analysts’ earnings estimates, which have barely changed post-tightening.
In addition to the rise in real and nominal interest rates, the Fed and other central banks are now contracting balance sheets at a time when government bond issuance remains high, withdrawing liquidity from financial markets and creating a liquidity hole. In the decade since the financial crisis, there has been excess liquidity from central banks buying assets. This buying drove assets up faster than the economy and meant that even with government debt rising, the government debt held by the private sector could stay flat. The private sector didn’t have to buy bonds; they just had to hold on. This is now reversing. For the first time in a while, the private sector must buy new bonds at a massively increasing clip in order for the market to clear. This requires a level of yields at which the private sector desires to buy them, not the yields that central banks want to create and are willing to accept in order to institute their policies.

The table below gives perspective on the magnitude of this liquidity hole. The amount of government debt that will need to be absorbed by the private sector in the coming months is larger than at any time outside of world wars (when the central bank engineered a safe risk premium on bonds) and the global financial crisis.

The impacts of the liquidity hole stretch far beyond the bond market. When a private player buys bonds, they have to either use cash (which they might have otherwise used to buy assets) or sell assets. The consequence is that the liquidity hole is showing up not just in the bond market, but in the equity market and in other assets. The chart below shows the impact we have already seen this year from the liquidity hole trickling through all assets. Looking ahead, this is getting worse, not better.

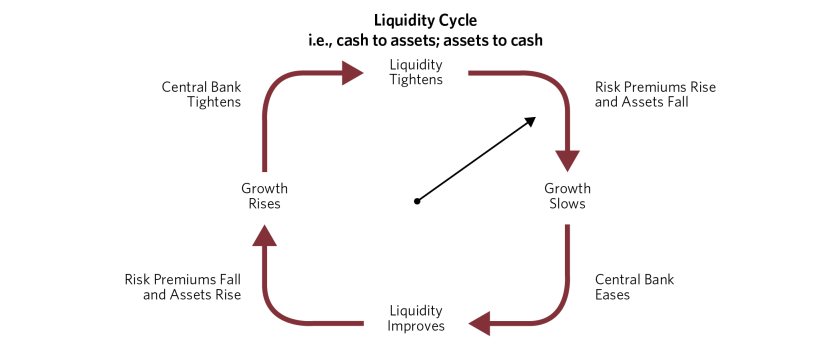
As we progress through the tightening cycle, what likely comes next is a weakening of economies. The following diagram illustrates where we are in the liquidity cycle, which is the tendency of money to move from assets to cash or from cash to assets. Starting from economic contractions in the pandemic there was an aggressive easing, then the declines in discount rates and risk premiums and rises in asset values, then the pickup in economies, which led to inflation, then the tightening and rise in discount rates in response to that. What comes next is the rise in risk premiums and the weakening of economies.
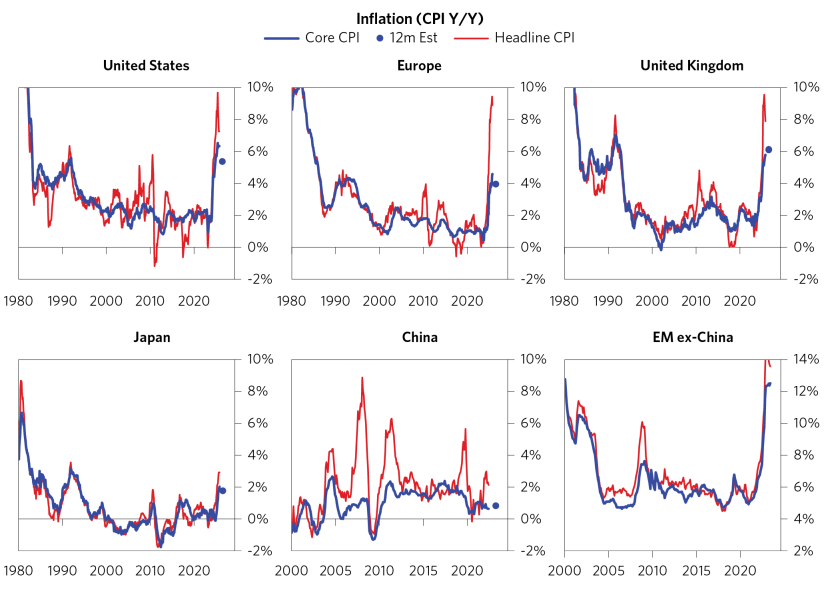
The charts below show our most timely read of current economic conditions across countries, as well as our leading estimates. China’s divergence from the other developed economies is clear.

Our leading estimates of inflation indicate that economies have not weakened enough for long enough to move inflation rates very far toward central bank targets or what the markets are discounting. Again, China and Japan are experiencing different inflation conditions leading to very different policies and diversifying asset returns.
To put this most recent chapter in the context of the unfolding story, we invite you to revisit our CIO updates from our 1Q 2022 and 2Q 2022 reports.
This research paper is prepared by and is the property of Bridgewater Associates, LP and is circulated for informational and educational purposes only. There is no consideration given to the specific investment needs, objectives or tolerances of any of the recipients. Additionally, Bridgewater's actual investment positions may, and often will, vary from its conclusions discussed herein based on any number of factors, such as client investment restrictions, portfolio rebalancing and transactions costs, among others. Recipients should consult their own advisors, including tax advisors, before making any investment decision. This report is not an offer to sell or the solicitation of an offer to buy the securities or other instruments mentioned.
Bridgewater research utilizes data and information from public, private, and internal sources, including data from actual Bridgewater trades. Sources include BCA, Bloomberg Finance L.P., Bond Radar, Candeal, Calderwood, CBRE, Inc., CEIC Data Company Ltd., Clarus Financial Technology, Conference Board of Canada, Consensus Economics Inc., Corelogic, Inc., Cornerstone Macro, Dealogic, DTCC Data Repository, Ecoanalitica, Empirical Research Partners, Entis (Axioma Qontigo), EPFR Global, ESG Book, Eurasia Group, Evercore ISI, Factset Research Systems, The Financial Times Limited, FINRA, GaveKal Research Ltd., Global Financial Data, Inc., Harvard Business Review, Haver Analytics, Inc., Institutional Shareholder Services (ISS), The Investment Funds Institute of Canada, ICE Data, ICE Derived Data (UK), Investment Company Institute, International Institute of Finance, JP Morgan, JSTA Advisors, MarketAxess, Medley Global Advisors, Metals Focus Ltd, Moody’s ESG Solutions, MSCI, Inc., National Bureau of Economic Research, Organisation for Economic Cooperation and Development, Pensions & Investments Research Center, Refinitiv, Rhodium Group, RP Data, Rubinson Research, Rystad Energy, S&P Global Market Intelligence, Sentix Gmbh, Shanghai Wind Information, Sustainalytics, Swaps Monitor, Totem Macro, Tradeweb, United Nations, US Department of Commerce, Verisk Maplecroft, Visible Alpha, Wells Bay, Wind Financial Information LLC, Wood Mackenzie Limited, World Bureau of Metal Statistics, World Economic Forum, YieldBook. While we consider information from external sources to be reliable, we do not assume responsibility for its accuracy.
The views expressed herein are solely those of Bridgewater as of the date of this report and are subject to change without notice. Bridgewater may have a significant financial interest in one or more of the positions and/or securities or derivatives discussed. Those responsible for preparing this report receive compensation based upon various factors, including, among other things, the quality of their work and firm revenues.